AgrifoodV ·
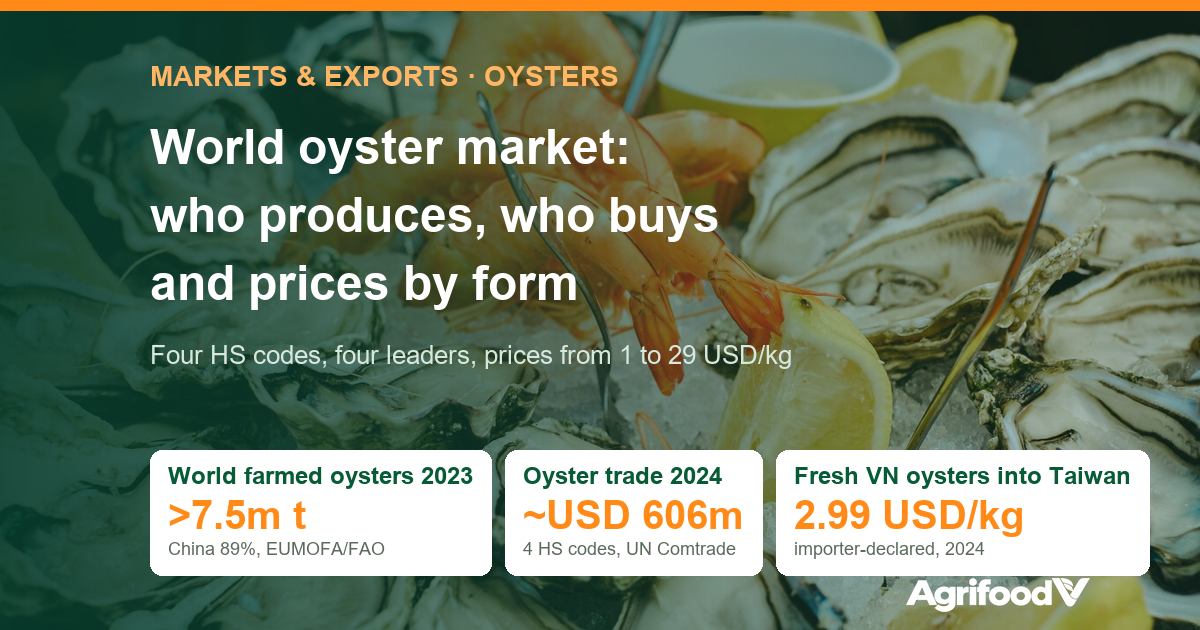
The world farms more than 7.5 million tonnes of oysters a year, yet cross-border oyster trade is worth only about USD 600 million. The market splits into four segments by product form, each led by one country, and unit values differ by almost 30 times between bulk fresh oysters and premium dried oysters. This article reads UN Comtrade and EUMOFA data to answer three questions: who produces, who buys, and what each form of oyster is paid.
Key points
- China accounts for 89% of world farmed oyster output (2023) but consumes almost all of it at home. Trade is therefore very small relative to production.
- In 2024 the four HS codes added up to about USD 606 million of exports. France leads live and fresh oysters, Korea leads frozen oysters, and China leads prepared and canned oysters.
- The main buyers are the United States, Italy, France, Japan and Hong Kong. Japan is the world’s largest importer of frozen oysters and buys 97% of that volume from Korea.
- Fresh Vietnamese oysters entered Taiwan at about USD 2.99/kg; frozen Japanese oysters entered Hong Kong at USD 15.15/kg; dried oysters entered Hong Kong at an average of USD 29.15/kg (2024).
Who produces: one country holds almost nine-tenths
According to EUMOFA (the European Commission’s market observatory for fisheries and aquaculture), citing FAO data, world farmed oyster output exceeded 7.5 million tonnes in 2023, up 50% from 2014. China accounted for 89%, Korea 4%, and the United States and Japan 2% each. Wild-caught oysters total only about 101,700 tonnes, of which the United States accounts for about 60% and Korea about 24%.
Outside China, the well-known producing regions are all small. The EU farmed about 106,800 tonnes in 2023; France accounted for 85%, and Pacific oysters made up 96% of the bloc’s output. Japan farmed 158,789 tonnes of shell-on oysters in 2021 according to the survey of the Ministry of Agriculture, Forestry and Fisheries (MAFF), with Hiroshima alone at about 58%. Korea’s Ministry of Oceans and Fisheries (MOF) puts the country’s output at about 310,000 tonnes in 2022, with a target of 400,000 tonnes by 2030.
The consequence for sellers: oysters are a product whose largest producer is also its largest consumer. There is no giant import market waiting; every export order has to be won from a supplier that is already there.
Four trade segments, four leading countries
UN Comtrade splits oysters into four codes: 0307.11 (live, fresh, chilled), 0307.12 (frozen, including oyster meat and half-shell oysters), 0307.19 (dried, salted, in brine, smoked) and 1605.51 (prepared or preserved, including canned). AgrifoodV adds up the export values reported by countries to about USD 640 million in 2023 and USD 606 million in 2024. Oyster sauce and oyster extract share codes with other sauces and extracts, so they cannot be separated.
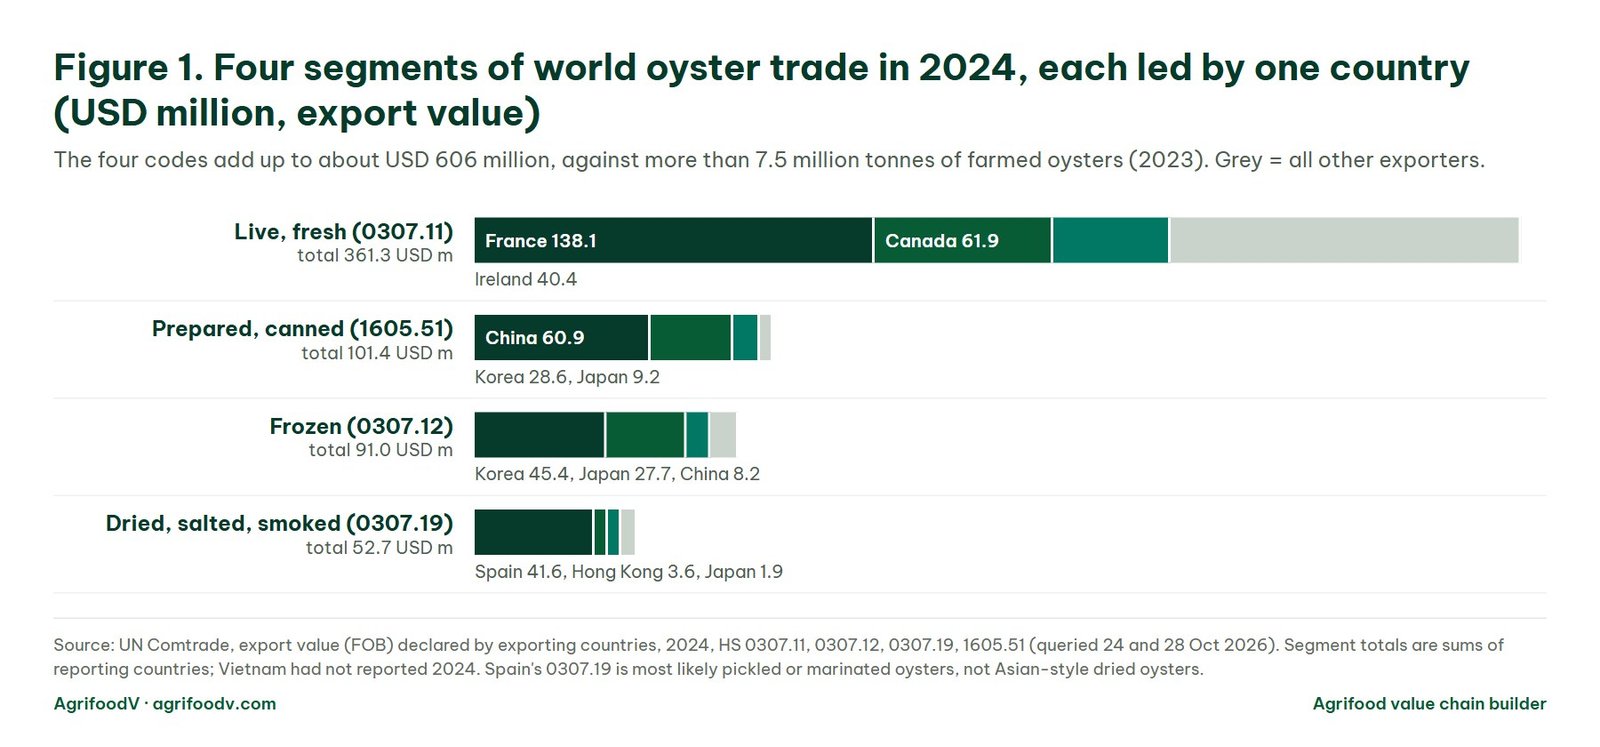
The live and fresh segment is the largest, at about USD 361 million, held by France (USD 138.05 million), Canada (USD 61.90 million) and Ireland (USD 40.40 million). The frozen segment is about USD 91 million; Korea holds almost half of it (USD 45.43 million), with Japan in second place. The prepared segment is about USD 101 million; China leads with USD 60.86 million, of which USD 35.41 million went to the United States. The dried, salted and smoked segment is the smallest; Spain ranks first by value, but this is most likely pickled or marinated oysters rather than Asian-style dried oysters.
Who buys: the United States, Japan, Hong Kong and Southern Europe
| Segment | Major importers (import value, CIF) | Who supplies them |
|---|---|---|
| Live, fresh (0307.11), 2023 | United States USD 74.12 million; Italy USD 50.30 million; France USD 42.68 million; Hong Kong USD 33.06 million; China USD 24.79 million | France, Canada, Ireland; China alone buys about 70% of its fresh oysters from France (2024) |
| Frozen (0307.12), 2024 | Japan USD 27.22 million; United States USD 16.68 million; Taiwan USD 12.62 million; Hong Kong USD 10.00 million; Singapore USD 5.49 million | Korea supplies 97% of Japan’s imports and 94% of US imports; Japan supplies premium product to Hong Kong |
| Dried, smoked (0307.19), 2024 | Hong Kong USD 11.80 million; United States USD 3.58 million; Singapore USD 1.97 million | Korea USD 6.65 million and Japan USD 3.99 million into Hong Kong |
| Prepared, canned (1605.51), 2024 | United States USD 37.23 million; Canada USD 7.36 million; Australia USD 4.93 million; Japan USD 4.73 million | China and Korea |
Seen from the buyer side, oysters are a market of a few stable trading pairs: France with Italy and China, Korea with Japan and the United States, and China with the United States for canned product. Japan stands out because it is both a producer and the world’s largest importer of frozen oysters, and the 2025 Hiroshima crop suffered mass mortality of 80–90% in some areas according to Jiji Press.
Prices by product form
The unit values below are calculated by AgrifoodV as value divided by net weight, using only rows with actually declared weights (rows with estimated weights are excluded). FOB values are declared by the exporting country and CIF values by the importing country, so the two are not on the same basis; size and quality differences are not reflected.
| Product form | Trade flow, 2024 | USD/kg |
|---|---|---|
| Live, fresh | China → Vietnam (FOB, declared by China) | 1.05 |
| Vietnam → Taiwan; → Thailand (CIF, declared by the importer) | 2.99; 3.02 | |
| France → Italy; France → China (FOB, declared by France) | 6.13; 10.23 | |
| Canada, average export (FOB) | 11.39 | |
| Frozen | Vietnam → Japan (CIF, declared by Japan) | 5.17 |
| Korea → Japan; → United States (FOB) | 6.79; 8.26 | |
| Japan → Hong Kong (CIF) | 15.15 | |
| Prepared, canned | China → United States (FOB); US average import (CIF) | 9.91; 6.89 |
| Korea → Hong Kong (FOB) | 25.43 | |
| Dried, smoked | Hong Kong average import; from Korea; from Japan (CIF) | 29.15; 25.62; 32.81 |
In Europe, EUMOFA records a French farm-gate oyster price of EUR 6.49/kg (2023) and a wholesale price for creuse fine size 2 at the Rungis wholesale market of EUR 8.85/kg (2024). Two points follow from the table: first, for frozen oysters entering Japan, the import price of Vietnamese product (USD 5.17/kg) is about one quarter below Korean product (USD 6.95/kg, also declared by Japan); second, the price tiers above USD 15/kg currently belong to Japanese and Korean product sold into Hong Kong and Singapore, that is, suppliers that already have recognised harvesting areas and long-standing trading relationships.
Where Vietnam stands in this picture
According to importing countries’ declarations on UN Comtrade, in 2024 Taiwan imported 3,780 tonnes and Thailand 2,563 tonnes of fresh oysters from Vietnam, almost all whole oysters at about USD 3/kg. Frozen and prepared product was below USD 1 million: Japan imported 59 tonnes of frozen oysters, and Middle Eastern countries a few dozen tonnes. In the same year China declared exports of 3,517 tonnes of fresh oysters to Vietnam at about USD 1.05/kg, putting pressure on prices in the domestic market itself.
In other words, Vietnamese oysters sit on the lowest rung of the price ladder, in the segment with the most sellers. Moving up requires changing the product form (cooked frozen, half-shell, prepared, dried) and, at the same time, gaining market access. The conditions of each market (EU, United States, Japan), duties and harvesting-area standards are analysed in the pillar article Oyster processing in Vietnam: markets, duties, standards and value-added products.
What companies should do
AgrifoodV recommendations:
- Choose the segment before the machines: each HS code is a different customer group, price level and competitor. The frozen segment competes head-on with Korea; the canned segment competes with China.
- Read prices on the right basis: compare FOB with FOB and CIF with CIF, and only trust unit values calculated from rows with actually declared weights. Offer prices must add refrigerated freight, insurance and each market’s import duty.
- Target gaps that really exist: Japan’s demand for frozen oysters while the Hiroshima crop is short, and frozen and dried product for Hong Kong and Singapore. Each gap must be confirmed by buyer enquiries, not by market reports.
- Start with small, consistent lots: oyster buyers pay more for supply that is consistent in size and quality over several seasons than for a single large lot.
AgrifoodV supports companies with market, price and import-requirement analysis before they decide to invest in a plant. Further reading: The journey of building an export processing plant.
References
- EUMOFA (European Commission). Species profile: Oysters (FAO production 2023, EU prices 2023–2025). fishery-aquaculture-market-observatory.ec.europa.eu.
- UN Comtrade. Trade data for HS 0307.11, 0307.12, 0307.19 and 1605.51, 2023–2024, by reporter and partner (queried 24 October 2026 and 28 October 2026; unit values calculated by AgrifoodV, only from rows with actually declared weights). comtradeplus.un.org.
- Ministry of Agriculture, Forestry and Fisheries of Japan (MAFF). Fishery and aquaculture production survey 2021, farmed oysters by prefecture (via a mirror of e-Stat data). ecitizen.jp.
- Ministry of Oceans and Fisheries of Korea. Plan for developing the oyster farming industry, 9 January 2025 (via SBS Biz and Aju News). biz.sbs.co.kr; ajunews.com.
- Jiji Press via Adnkronos. Hiroshima oyster farmers face catastrophic blow from mass deaths, 20 November 2025. english.adnkronos.com.
- VASEP. Oyster exports continue to grow, 23 July 2024. seafood.vasep.com.vn.
Article by AgrifoodV, compiled from the sources above (accessed 24–28 October 2026). Trade totals are sums of countries reporting to UN Comtrade; Vietnam had not reported 2024, so Vietnamese oyster figures are taken from the importing countries’ side. Unit values do not reflect differences in size, quality or delivery terms. This content is not a substitute for legal advice. Cover image: Svitlana Shakalova / Pexels.
Looking at Vietnam as a sourcing origin or a place to build a value chain?
Tell us your product, target market and expected volumes. In a 30–45 minute online call, AgrifoodV reviews buyers, standards, processing capacity and growing areas with you, starting from the market.
Book a call →Sourcing from Vietnam© 2026 AgrifoodV. Nội dung được phép trích dẫn khi ghi rõ nguồn và đặt liên kết tới bài gốc; không sao chép toàn văn. Xem Điều khoản sử dụng nội dung.