AgrifoodV ·
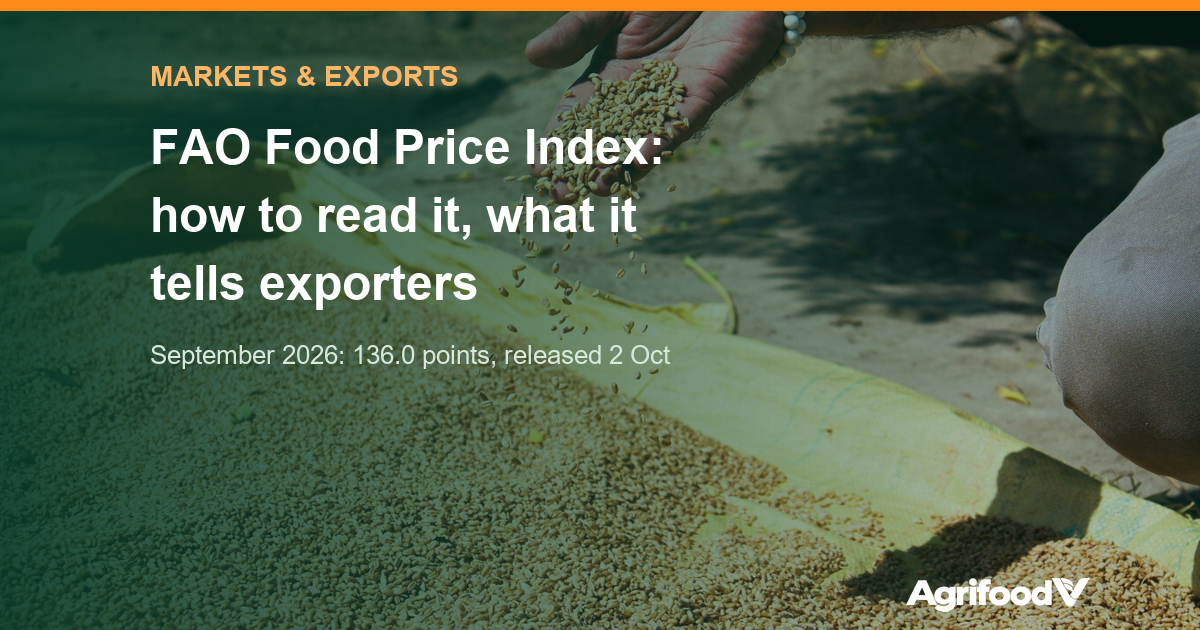
According to FAO’s release of 2 October 2026, the FAO Food Price Index (FFPI) averaged 136.0 points in September 2026, 5.8% higher than a year earlier but still 15.1% below its March 2022 peak. The figure is widely quoted, but it measures international prices for five commodity groups, not the prices of Vietnamese rice, coffee or fruit; misreading how it is built easily leads to the wrong conclusions about your own selling prices.
Key points
- The FFPI is the average of five commodity group indices (cereals, vegetable oils, dairy, meat, sugar), weighted by average export shares over 2014–2016; base 2014–2016 = 100.
- September 2026: cereals 122.8 points (+17.2% year on year), vegetable oils 198.6 (+18.3%), sugar 114.0 (+14.7%), dairy 119.1 (−19.1%), meat 127.9 (in line with a year earlier).
- Rice has its own index (the FAO All Rice Price Index), which rose 1.4% in September 2026. According to the National Statistics Office, Vietnam exported 6.45 million tonnes of rice worth USD 3.06 billion in the first nine months of 2026, down 5.4% in volume and 12.3% in value.
- FAO revises earlier months with every release. Next release: 6 November 2026 (October data).
How the index is calculated
FAO defines the FFPI as a measure of the monthly change in international prices of a basket of food commodities. It consists of five commodity group indices, averaged using each group’s export share over 2014–2016 as weights; from July 2020, FAO moved the base period to 2014–2016 = 100 and expanded the price coverage. So 136.0 points means that the average international price of the basket is about 36% above its 2014–2016 level, in nominal US dollars. FAO also publishes a set of real (inflation-adjusted) indices in the same data file.
Three technical points to know before quoting the figures:
- FAO publishes on a fixed monthly schedule. Two releases remain in 2026: 6 November (October data) and 4 December (November data).
- The latest month may be revised in the following release. The meat index is the clearest case: most meat prices are not yet available when FAO computes the index, so recent months rely partly on projected prices. For example, September’s 2.0-point rise is measured against the revised August level (134.0 points). When quoting, state the release date and take the figures from the latest release.
- The basket does not include coffee, cashew nuts, pepper, fruit and vegetables or seafood, the groups that make up a large share of Vietnam’s agricultural exports. Rice sits within cereals, and FAO tracks it separately through the FAO All Rice Price Index in its monthly rice price bulletin.
September 2026 figures by group
| Index (2014–2016 = 100) | September 2026 | vs August | vs September 2025 | Drivers cited by FAO |
|---|---|---|---|---|
| Overall FFPI | 136.0 | +1.5% | +5.8% | All three crop groups rose; meat fell, dairy was stable |
| Cereals | 122.8 | +5.1% | +17.2% | Wheat at its highest since August 2023, maize at its highest in more than three years; Black Sea shipping disruptions, concerns over shipping through the Strait of Hormuz |
| Vegetable oils | 198.6 | +0.9% | +18.3% | Palm oil up for a fourth consecutive month; soy oil supported by biofuel demand |
| Meat | 127.9 | −1.1% | unchanged | Lower poultry and pig meat prices |
| Dairy | 119.1 | −0.1% | −19.1% | Cheese down, milk powder up |
| Sugar | 114.0 | +6.1% | +14.7% | Highest since April 2025; tighter 2026/27 supply expected in the EU, Thailand and India; rain delaying the harvest in Brazil |
| Rice (All Rice Price Index) | not stated in the FFPI release | +1.4% | not stated | Indica prices rose on weather concerns and seasonally tighter supplies |
On the same day, FAO’s Cereal Supply and Demand Brief forecast world rice production in 2026 at about 552.5 million tonnes. The AMIS Market Monitor cited by FAO notes that rice yields during El Niño events are typically 1.0–1.5% below trend.
International prices and Vietnam’s rice export prices do not move together
The cereal index’s 17.2% year-on-year rise is driven mainly by wheat and maize. Vietnam’s rice export prices moved in a different direction. According to the preliminary September 2026 tables of the National Statistics Office (Ministry of Finance):
| Vietnam rice exports | Volume (thousand tonnes) | Value (USD million) | Year on year: volume / value |
|---|---|---|---|
| September 2026 | 423.4 | 223.3 | −9.3% / −3.7% |
| Q3 2026 | 1,403.8 | 674.3 | −33.3% / −35.2% |
| First nine months of 2026 | 6,452.4 | 3,056.7 | −5.4% / −12.3% |
Dividing value by volume gives an average price of about USD 474 per tonne for the nine months and about USD 527 per tonne for September alone. Average prices also reflect the mix of rice types shipped each month, but September’s price being above the nine-month average is consistent with the 1.4% rise in FAO’s rice price index. Over the nine months, the NSO’s rice export price index was still 6.61% lower year on year, the opposite direction to the overall cereal index. Using the FFPI or the cereal index to forecast rice prices means reading the wrong basket.
What the index tells exporters and processing plants
For products outside the basket, such as coffee, fruit and seafood, the FFPI says nothing directly about selling prices. It is useful in two other ways. First, input costs: vegetable oils near 199 points, sugar at its highest since April 2025, and sharp rises in maize and wheat signal higher costs for plants using frying oil, sugar and wheat flour, and for the animal and aquaculture feed chain. Second, importing countries’ purchasing power: rising food prices push up the food import bills of major rice-buying countries, and their governments may change import policies. This is AgrifoodV’s assessment and should be checked against information for each market.
For sweetened drinks and juices, sugar prices are only part of the picture; the Gulf also levies a tiered sugar tax by sugar content, see the article on Vietnamese fruit juice in the UAE and Saudi Arabia.
What companies should do
The following are AgrifoodV’s recommendations.
- Read by group, not by the headline figure. Rice exporters should follow the FAO All Rice Price Index and the quotations by origin in the monthly rice price bulletin, then compare them with their own actual export prices.
- When quoting FAO figures in reports, offers or contracts, state the month of the data and the release date, and update after each release because FAO revises earlier months.
- Plants that use large amounts of imported sugar, vegetable oils or cereals can use the corresponding group index as a reference when negotiating price-adjustment clauses in long-term contracts with customers.
- Put the release dates (6 November and 4 December 2026) into the pricing plan for Q1 2027.
AgrifoodV helps companies read market data and choose markets and segments before quoting prices. How to build hard-to-copy advantages when market prices swing is discussed in the article on how export agricultural products can stand out.
References
- FAO. FAO Food Price Index: FAO Food Price Index edges up in September on higher sugar, cereal and vegetable oil prices, released 2 October 2026; data file Nominal and real indices from 1990 onwards (October 2026 version). fao.org.
- FAO. FAO Food Price Index rises in September amid weather concerns and transport disruptions (press release, with the Cereal Supply and Demand Brief and AMIS Market Monitor), 2 October 2026. fao.org.
- FAO. FAO Rice Price Update (FARPI overview, 2026 release calendar). fao.org.
- National Statistics Office (Ministry of Finance). Báo cáo tình hình kinh tế – xã hội quý III và 9 tháng năm 2026 [Socio-economic situation report for Q3 and the first nine months of 2026], tables 26 (exports of goods), 28 (exports by quarter), 35 (export price index), October 2026. nso.gov.vn.
Article by AgrifoodV, compiled from the sources above (accessed 29 October 2026). FAO figures are September 2026 data from the release of 2 October 2026 and may be revised by FAO in later releases; rice export figures are preliminary NSO data, and average prices were calculated by AgrifoodV from volume and value. The recommendations are AgrifoodV’s assessment. This content is not a substitute for legal advice. Cover image: Swastik Arora / Pexels.
Looking at Vietnam as a sourcing origin or a place to build a value chain?
Tell us your product, target market and expected volumes. In a 30–45 minute online call, AgrifoodV reviews buyers, standards, processing capacity and growing areas with you, starting from the market.
Book a call →Sourcing from Vietnam© 2026 AgrifoodV. Nội dung được phép trích dẫn khi ghi rõ nguồn và đặt liên kết tới bài gốc; không sao chép toàn văn. Xem Điều khoản sử dụng nội dung.